How Many Photons Are There in a Lumen?
What You Will Learn
- LED lumen ratings do not directly indicate the number of photons captured by a camera, necessitating conversion for precise illumination control.
- The process involves digitizing spectral power curves, normalizing them, and converting watts to photons per second using fundamental first principles.
- This methodology is crucial for applications involving rapid motion, where short exposure times are needed to prevent blurring while maintaining image clarity.
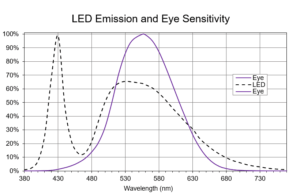
Figure 1A: Relative power output of a white LED (Ρn (λ) ), and the eye photopic sensitivity curve V (λ). A phosphor on the LED is used to convert the blue LED to white, but much of the power is outside the eye’s sensitivity range.
Editor’s note: Bodkin Design & Engineering (Newton, MA, USA) confronted the issue of controlling motion blur in video imaging while working on a project involving high-speed helicopter blades. However, the idea of choosing the correct exposure for the camera applies to any project involving LED illumination—not just those involving motion, says Andrew Bodkin, the company’s founder. To set up the camera and LEDs correctly, you need to know how many photons are in a lumen of LED flux, he says. Because this information is not available in LED spec sheets, the Bodkin team developed a method to calculate the information and shares the step-by-step approach here.
When designing a machine vision system, it is important to determine if there will be sufficient illumination for a good image. The lights must be selected along with the lenses, the image chip, and the layout of the camera and illuminators. Without sufficient light, even the best machine vision system can fail.
This is particularly critical if the subject is moving rapidly, requiring a short exposure to prevent blurring. There is a trade-off between exposure time and motion blur. The longer the exposure, the better the imagery but the greater the motion blur.
LED lighting has become the standard illumination source. LEDs are rated in lumens, which describe how bright they look to the human eye, not how a camera sees them. In fact, cameras pick up a wider range of wavelengths, which means much of the illumination falls outside the visual sensitivity curve used to define the lumen. There is actually more light in the LED lamp than described by the lumen rating. This works to our advantage for light-starved imagery.
To predict image quality, LED output must be converted into photons per second per wavelength and matched to the camera pixel spectral sensitivity. Since LED specs do not provide this information, it has to be worked out from first principles—a method engineers use to break a problem down into fundamental truths before building a solution.
This article will show how to convert LED ratings from lumens to spectral flux in photons.
Scene illumination is determined from the spotlight datasheets or from modeling. Depending on lens f-number, pixel size, and object reflectivity, the illumination at the pixel can be calculated. For rapidly moving objects, the question is: What is the shortest exposure time we can use and still have reasonable imagery?
To evaluate this, we need to determine how much the exposure fills the detector well. To determine the well fill of the pixel and the resulting signal-to-noise ratio, the number of detected photons has to be calculated. For incandescent illumination this can be done using a blackbody calculator. However modern lighting uses LEDs, whose spectral photon flux (the number of photons per second per unit area) is not available on the datasheets.
LED manufacturers report the total flux in lumens and the relative spectral power distribution as a normalized curve (Figure 1). We want to derive the scale factor used to normalize the curve from the lumen rating and convert the curve back to watts.
The curve was created by measuring the spectral output of the LED with a spectrometer in watts (P (λ) ), then dividing it by the maximum value (Μ) to give a normalized curve. To characterize the total power from the LED, the illumination is measured with a meter that is fitted with a filter to mimic the spectral sensitivity of the eye and read out in lumens.
Figure 1A: Relative power output of a white LED (Ρn (λ) ), and the eye photopic sensitivity curve V (λ). A phosphor on the LED is used to convert the blue LED to white, but much of the power is outside the eye’s sensitivity range.
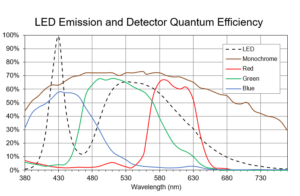
Figure 1B: Comparison of the LED to the Quantum Efficiency of the camera’s detectors, both monochrome and RGB. The camera detects more of the LED output than the human eye.
To recover the spectral power curve in watts from the relative spectral power curve, we need to find (Μ) the maximum emission value that was used to normalize the curve.
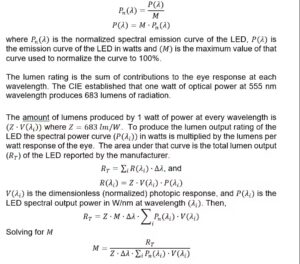
We use a spreadsheet to determine the value of (Μ), and create the power curve of the LED in watts. This is then converted to photons/second with Planck’s constant and the speed of light.
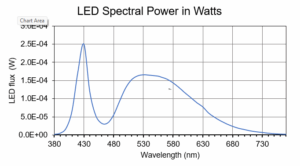
Figure 2A: An example LED provides 1 lumen of power. When run through the spreadsheet math, the output in watts is plotted.
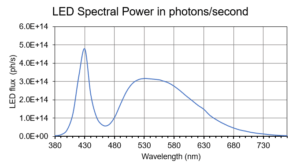
Figure 2B: That plot is converted to photons/second. It is this photon flux that is converted by the pixels to electrons and is recorded as the image data.
We digitized the curves representing the LED relative spectral power distribution, the eye photopic visual efficiency, and the camera spectral quantum efficiency every 10 nm over the 400 to 750 nm range and entered them into a spreadsheet (Figure 3).
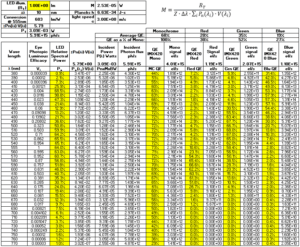
Figure 3: The digitized spreadsheet. The input is the lumen power from the LED, the normalized spectral output of the LED, and the camera spectral quantum efficiency for monochrome and RGB pixels (yellow). The output is the signal in photons/second from each detector. For this particular LED and image chip we find that the detected quantum efficiency is 68% for monochrome and is reduced to R-30%, G-52%, and B-18%. (This spreadsheet is available for download at https://www.bodkindesign.com/photon-to-lumen-calculator/).
Figure 3 shows the spreadsheet we used to calculate the photon flux from the lumen rating. LEDs can have different phosphors resulting in a different relative spectral power curve, and the image chip can have different QEs. Therefore, new curves will need to be digitized for each design. Printed curves from the datasheets can be digitized using a free online application. For this particular LED, the total photon rate for 1 lumen flux is 5.9×10¹⁵ ph/s. And for this particular image chip, the monochrome net quantum efficiency is 68%, the red is 20%, blue 19% and green 35%.
To determine the image exposure for the camera, calculate the electrical signal from the pixel. To do that, determine the LED lumen flux on each pixel, convert it to photons/second, multiply by the quantum efficiency curve of the pixel and the exposure time. This will yield the charge in the pixel detector well. From this, the well fill, digitizing counts and signal-to-noise can be calculated. This process is the topic of a future article.
Author’s note: I would like to thank Jim Daly, chief scientist at Bodkin Design & Engineering; Adam Norton, optical consultant; and Mike Zollers, senior illumination systems engineer at Synopsys (Sunnyvale, CA, USA) for their support in developing this derivation.